
By Matthew Spinks, I.T., Data Analysis & Research Consultant
The rapid growth of illegal betting markets
The sports sector has undergone rapid and comprehensive change in recent decades. Globalization, underpinned by the information and communications technology revolution, has led to a huge influx of money at the top level of professional sport, most notably through the growth in audiences for elite-level sports and the advertising and marketing opportunities that have arisen in consequence.
The way we play and consume sport has been transformed, and nowhere has this been more evident than in the explosive growth in sports betting, both legal and illegal, that has occurred over the last decade. Indeed, illegal betting on sport has now become a global issue, with the financial scale of the problem being such that illegal betting is now a major driver of corruption in sport and a major channel for money-laundering, including by organized crime groups.
A key characteristic of illegal betting on sport is its transnational nature: it is possible to illicitly bet on a sporting event occurring in the US from, say, Kenya, with an illegal agent operating in Russia. The transnational nature of many illegal betting operations presents a challenge to authorities attempting to combat such activities, as national authorities especially must typically limit the scope of their operations to their own jurisdictions by fiat. The situation is further complicated by uneven national legislative frameworks, the use of innovative bet types, the growth of cryptocurrencies for anonymous payments, and the proliferation of online gambling in general.
The illegal market for betting on sports is estimated to be between USD 350 billion and USD 1.7 trillion, according to the most authoritative recent report on the subject, the 2021 Global Report on Corruption in Sport from the United Nations Office on Drugs and Crime (UNODC). For comparison, the WLA through its Global Lottery Data Compendium estimates the size of the global legal state-regulated lottery and sports betting sector at USD 384.7 billion for 2021. For context, the WLA puts global money to good causes raised by the lottery and sports betting sector at USD 93.2 billion in 2021; the corresponding potential loss to good causes based on the upper estimate (USD 1.7 trillion) of the size of the illegal gaming market according to the UNODC report is USD 411.9 billion.
There are many negative effects on the social ecosystem when customers choose to bet with illegal operators. Downstream impacts include: the loss of funds – potentially up to USD 412 billion – that would otherwise be channelled to good causes; a potential increase in problem or pathological gambling given the inducement to spend and associated lack of Responsible Gaming (RG) tools; and many other social ills.
Understanding the magnitude of the illegal gaming market and its trends is thus crucial to both the state-authorized lottery and gaming sector as a whole, and to individual state-regulated lottery and sports betting operators. In consequence, numerous industry stakeholders, including the American Gaming Association in the US, and the Asian Racing Federation in Hong Kong, are actively engaged in sizing the illegal gaming market. Among WLA members, Singapore Pools has recently taken the lead in sizing the illegal betting market in their jurisdiction, motivated in particular by the desire to better understand key performance indicators like the Legal Coverage Ratio (LCR); the LCR metric tracks the size of the legal market over the size of the total market (illegal + legal). Better understanding of such key metrics is extremely helpful in regulating the market with the aim of minimising problem gaming; thus, Singapore Pools’ interest in sizing their local illegal betting and gaming market is ultimately driven by their unwavering commitment to responsible gaming.
Approaches to illegal market sizing
There are two main approaches to sizing legal markets: bottom up and top down. The bottom up approach sizes a market by obtaining data about individual entities and extrapolating or projecting from the data sample to obtain market size estimates (the ‘addressable’ market). For example, the WLA Global Lottery Data Compendium uses a bottom-up approach to obtain its estimates of the size of the regulated gaming market operated by WLA lottery and sports betting members: members are polled, and their responses are aggregated to determine the size of the global state-regulated lottery and sports betting market. In contrast, the top-down approach takes industry and regulatory data and socioeconomic parameters, which are typically used in sizing an overall ‘ideal’ or total market, and applies various selection criteria to obtain an estimate of the size of the actual or real market (the ‘addressable’ market).
Owing to the inherent difficulty in obtaining reliable information about illicit and illegitimate activities, approaches to sizing illegal markets typically reify and refine both the bottom-up and top-down approaches to sizing legal markets by placing greater emphasis on the use of estimates, models, extrapolation, and projection, to compensate for data scarcity, data unreliability, and other deficiencies in data. Thus, bottom-up approaches to sizing illegal betting markets are typically based on a representative sample of illegal gaming activities and behaviors obtained by survey; this base is then built on by applying scaling factors and other relevant parameters such as population characteristics to obtain an estimate of the addressable market. On the other hand, top-down approaches to sizing illegal betting markets typically begin with a collection of national and global estimates of illegal market size. This pool of data is then used to build a model that – when parameterized by relevant variables including economic data and legal market sizes – estimates the addressable market. For a graphical comparison of these approaches, see Figure 1; observe in particular that there is some overlap in approaches through the use of elements in common like estimation.
Each approach to illegal betting market sizing has its benefits and drawbacks. Given the obstacles associated with obtaining definite and reliable information about illegal gaming, however, bottom-up approaches towards sizing illegal betting markets that emphasize the survey component tend (perhaps unsurprisingly) to be comparatively common. Thus, for example, the most comprehensive and authoritative report yet produced estimating the size of the illegal gaming market in the United States, the 2022 report ‘Sizing the Illegal and Unregulated Gaming Markets in the United States’ from the American Gaming Association, obtains its estimates primarily from a survey of more than 5,000 Americans about their gaming habits.
Unfortunately, surveys can be limited by the very fact that respondents typically hesitate to share information on sensitive topics such as illegal gambling, especially when they feel they can be identified. Even if they are willing to do so, respondents typically cannot accurately recall their wins and losses, and tend to overstate wins. Furthermore, the phrasing of questions can have a large impact on reported values. There are also selection biases to contend with, as respondents might not be truly representative of an operator’s customer base. And, high-wealth individuals are typically under-represented or completely missing in population surveys.
The preceding discussion notwith-standing, surveys have their proper place. Surveys are ideal for under-standing interest in games for instance, to get answers to declarative (yes/no) questions, or to understanding the prevalence of gambling. For example, across several commissioned studies, the popularity of products consistently converges, and the differences in adult gambling participation are minimal.
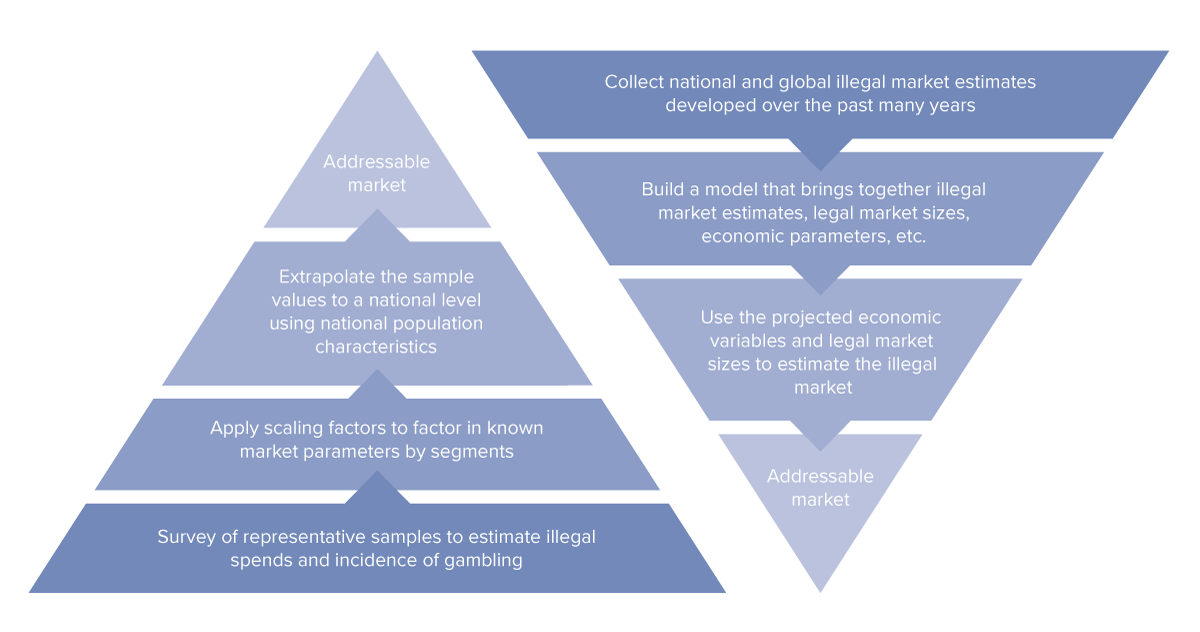
Figure 1. Bottom up (left) and top down (right) approaches to illegal market sizing.
The Total Addressable Market model, and results
When investigating the possibility of using a bottom-up, survey-based approach for estimating the size of the illegal betting and gaming market in Singapore, Singapore Pools encoun-tered additional difficulties beyond those remarked upon previously. The company found it empirically difficult, for example, to obtain adequate sampling sizes for less popular markets. Given the spend patterns across different sports and the manner in which they are distributed, it often proved hard to get a sufficient sample size to provide meaningful estimates with low margins of error. More generally, Singapore Pools observed that while it is possible to minimize statistical noise in a survey via adroit phrasing of questions, clever survey design, and sophisticated analysis of received data, in general it is difficult to handle all aspects correctly to obtain reliable estimates.
To address the shortfalls of surveys when sizing the illegal betting market in Singapore, Singapore Pools supplanted these with a top-down approach, based on the methodology of Figure 1, but where the market size was modelled using Machine Learning (ML), a form of Artificial Intelligence (AI), informed by industry data, economic parameters, and other relevant data. In other words, Singapore Pools developed an AI system that takes a range of economic and other variables as input, processes it using ML, and then outputs an estimate of market size according to specified characteristics. For more about ML, see the inset box ‘What is Machine Learning?’
Machine learning (ML) is a branch of AI and computer science devoted to understanding and building computational systems that leverage data and algorithms to let machines, i.e. computers, learn from experience. The key phrase here is ‘learn from experience’: such a system is able to evaluate its performance, optimize its processing accordingly, and in this way refine its results.
An algorithm is a finite sequence of instructions for performing a computation, much like a recipe is a set of instructions for preparing a particular dish. Machine learning algorithms build a model based on sample data, known as training data, in order to make predictions or decisions without being explicitly programmed to do so.
This works in the following way. Based on suitable input data, the algorithm produces or predicts estimates about the data. An error function then evaluates the model’s predictions. Given known examples, the error function can assess the accuracy of the model. If the model can be better fit to the data points in the training set, then parameters are adjusted to reduce the discrepancy between the known examples and the model estimate. The algorithm then repeats its evaluate and optimize process, updating parameters autonomously until a certain level of accuracy is met.
A Neural Network (NN) is a machine learning algorithm that works by mimicking the biological neural network that constitutes the human brain in order to model complex patterns in datasets. Informally, a NN is a collection of connected nodes, called artificial neurons (see Figure 3), that loosely model the biological neurons in the brain; the nodes can signal (transmit information) to one another, much like how the synapses in a human brain fire to transmit signals from neurons to other neurons.
In a NN, the artificial neurons are aggregated into an input layer, one or more hidden (intermediate) layers, and an output layer. See Figure 4. A neural network takes an input, passages it through the multiple hidden layers, and outputs a prediction representing the combined input of all the neurons. To do this, each node in a NN has an associ-ated weight and threshold; these parameters are used in conjunction with a nonlinear activation function to pass signals through the network, i.e. to determine when a node can signal to other nodes. For each node, its weight is used as an input to its activation function; if the output resulting from the activation function is above the node’s specified threshold value, the node is activated, sending a signal one or more neurons in the next layer of the network. Otherwise, the node passes no data to the next layer of the network.
Neural networks are ‘trained’ iteratively using certain optimization techniques. After each cycle of training, an error metric is calculated based on the difference between the desired and actual output values. Each neuron’s weights are then adjusted proportionately to how they contributed to the total error. This process is repeated until the network error drops below an acceptable threshold, at which point the network ideally models the desired complex phenomena.
Singapore Pools calls the model it has developed the Total Addressable Market (TAM) model. For inputs, the model relies predominantly on published economic variables and population characteristics obtained from recognized sources like the International Monetary Fund (IMF). For betting related figures, numbers were extracted from Singapore Pools’ internal data and industry intelligence services like H2 Gambling Capital for grey market data. For further details about the inputs, see Figure 2 (Input). Altogether, data from more than 20 different countries spanning 19 unique years is used to train the model.
The processing part of the TAM model is primarily based on a MultiLayer Perceptron (MLP) with one hidden layer. A MLP is a feedforward (i.e. unidirectionally forward) neural network enjoying certain other natural properties. Informally, an MLP is a
‘vanilla’ neural network, consisting as it does of an input layer, one or more hidden layers, and an output layer. Each node uses a nonlinear activation function to fire and signal to associated artificial neurons; a supervised learning technique called back propagation is utilized for training. See the inset box ‘What is a neural network?’ and Figures 2 (Processing) and 5 for details.
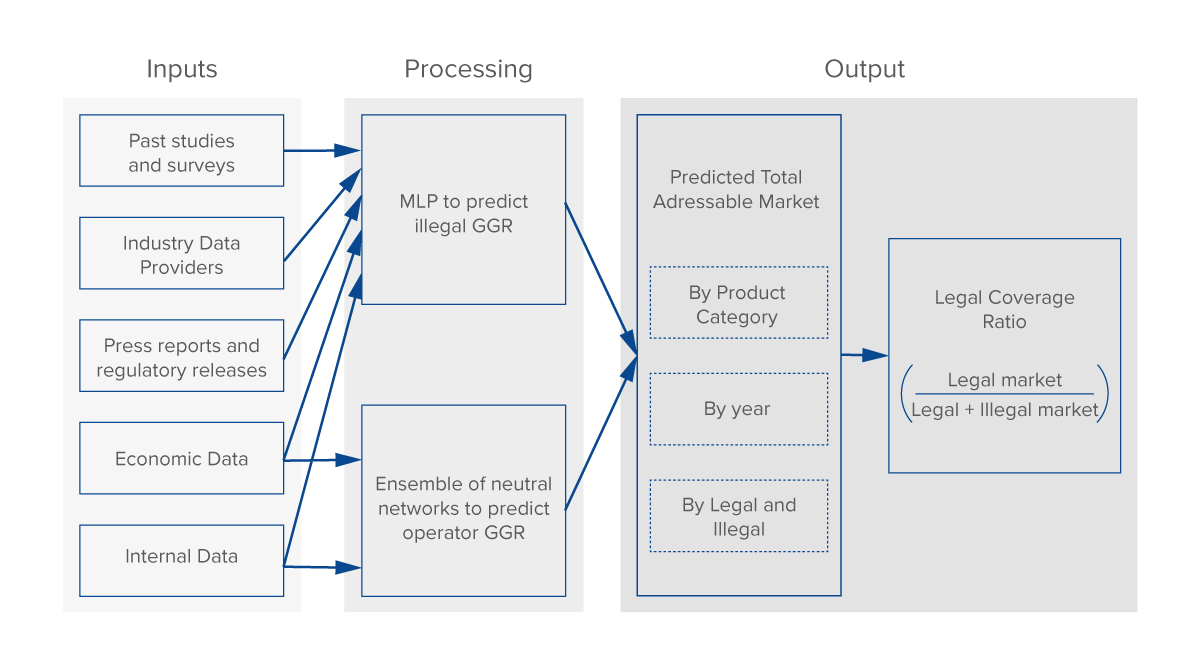
Figure 2. The Total Addressable Market model

Figure 3. Schematic of an artificial neuron
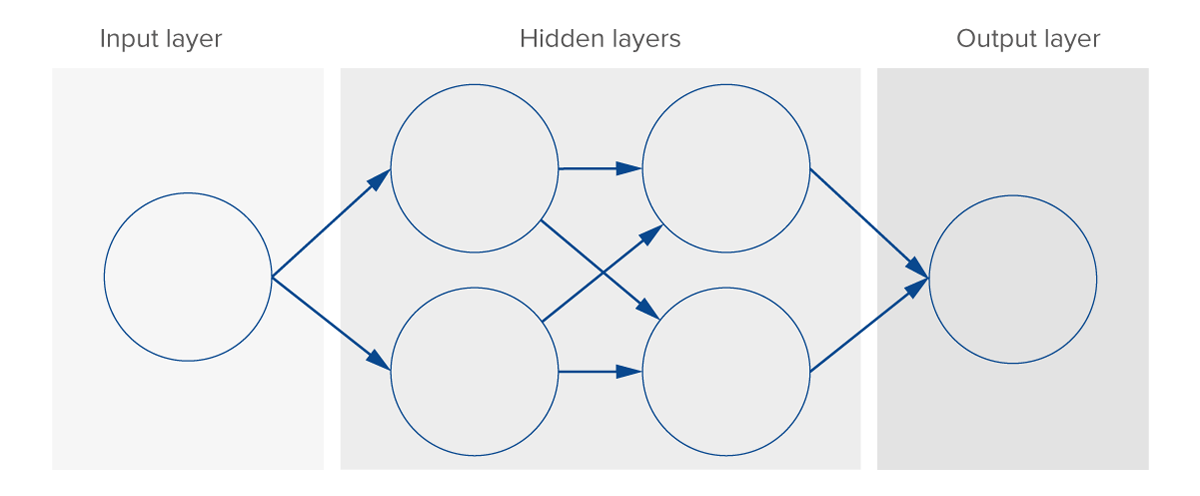
Figure 4. Schematic of a simple neural network
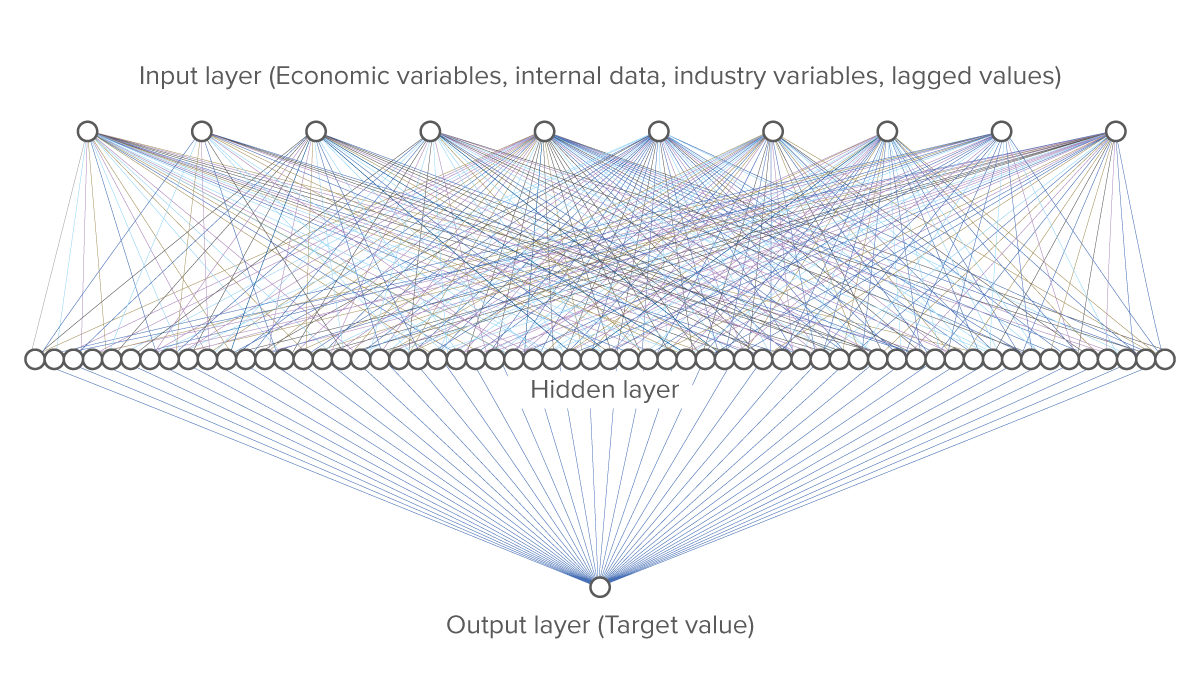
Figure 5. The Total Addressable Market model as a Multilayer Perceptron
Singapore Pools tested other types of models for their efficacy in estimating market size. It was found that owing to the relatively small amount of data (318 rows for training), an MLP with exactly one hidden layer had just the right level of complexity. Other models like ARIMAs (Auto-Regressive Integrated Moving Average, a statistical analysis model that uses time series data to either better understand the data set or to predict future trends) were too simple, while LSTMs (Long Short-Term Memory, a kind of recurrent neural network capable of learning long-term dependencies) were too complex, resulting in underfitting and overfitting of the training data respectively. The optimal parameters for the TAM model were selected based on a grid search, which is a particular way to exhaustively try all combinations of parameters.
Using market data from comparable regulatory regimes for benchmarking, Singapore Pools has run extensive back testing results and sanity checks to ensure that the results are reliable and consistent with the behavior of the market. Back testing is a way to validate time series models, where one makes sure not to leak future years into the test set. For example, to test the performance of the model at predicting five years into the future, one trains the model solely on data from 2003–2016, and then test the model on the period 2017–2021. (Values further than five years into the future are not reported on account of the uncertainties associated with extended time frames.)
The TAM model has been validated individually against Singapore and three other comparable countries, with high validation scores. A summary of the results obtained using the TAM model for estimating the size of the illegal gaming and betting market in Singapore can be found in Table 1. The table does not show estimates of market sizes by period/market segment directly; rather, it illustrates the performance of the TAM model in making predictions, in terms of a statistical measure known as the coefficient of determination, R2, whose values range from 0 to 1. Put simply, the better the TAM model is at making pre-dictions for a period/market segment, the closer the R2 value for the segment will be to 1. Thus, for instance, the TAM model perfectly predicts the market size for a period/market segment when the corresponding R2 value is 1. The key takeaways from Table 1 are that the model is performing well, and that – as one would expect – it performs better the more data is included or the fewer years it has to forecast.
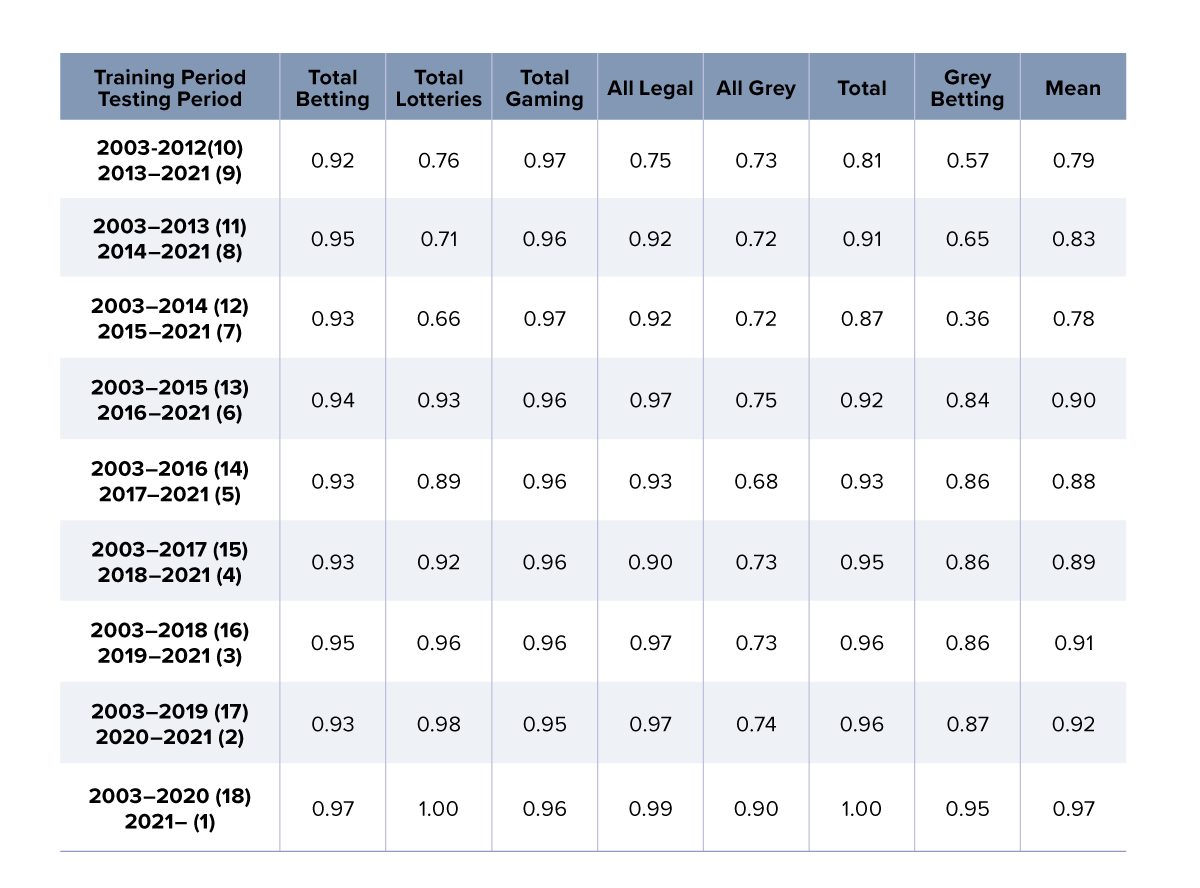
Table 1. Results from the TAM model. The values are coefficients of determination, R2. The coefficient of determination is a statistical measure indicating how well observed outcomes are replicated by the model. The closer the score is to 1.0, the better.

Next steps
As it stands, the core of the current TAM model only allows Singapore Pools to make predictions for broad product categories; finer-grained analysis, for example by product, is not yet possible.
While the current model is performing well, it can be difficult to explain the rationale behind its projected values owing to the non-interpretable nature of neural network weights. In other words, the model can predict values which are sometimes not in keeping with intuition or data, and no insight can be obtained into how the model derived its predictions on account of the fact that the model is a kind of ‘black box’. Singapore Pools aims to improve the TAM model in such a way that it becomes clear to stakeholders how different factors influence the model’s predictions and their respective magnitudes. This is possible today with contemporary tools like SHAP (SHapley Additive exPlanations), which provide explanations by attributing contributions to different features. Integrating such cutting-edge tools into the model should allow Singapore Pools to achieve the desired level of interpretability.
Even though the estimated values output by the TAM model are at best indicative and near impossible for Singapore Pools to validate the results, the company is of the belief that as time progresses, and with more data and enhancements, the TAM model will continue to give it robust insights into the size of the local illegal gaming and betting market.
For its part, the WLA through its Illegal Lotteries and Betting Committee (ILBC) is currently examining whether the TAM model developed by Singapore Pools can be adapted to cover jurisdictions beyond those studied by the Singaporean national operator. Ultimately, the WLA is interested in developing accurate estimates of the size of the illegal betting and gaming market geographically (regionally and globally), by market segment (product vertical), and so forth.
The WLA has recently stepped up its fight against illegal betting, match fixing, and corruption in sport in concert with its sister organization and partner, bet monitoring service ULIS (United Lotteries in Sport). In tandem with ULIS, the ILBC spearheads the WLA’s effort to protect the lottery and sports betting sector from corruption and criminal activity and to maintain the integrity and probity of state-authorized lotteries and sports betting operators.
With its broad worldwide membership, the WLA is particularly well suited to take a leading role in developing estimates of the size of the illegal betting and gaming market, possibly through a top-down, AI-informed approach to the topic, or via a combination of bottom-up methods (e.g. surveys) and top-down techniques. Currently, the association is actively engaged in this work. We look forward to reporting on subsequent developments both in relation to Singapore Pools’ TAM model and the WLA’s own work in illegal market sizing, in a future edition of the WLA magazine.